Problem Specification
1. Write a program to computing the “convex hull” of given N points.
[INPUT]
- A text file having N input 2D points:
23 // # of points
3.5 242 // first point coordinates
365.12 48 // second point coordinates
…
[OUTPUT]
- A postscript file
showing the points on the convex hull as “filled circle”
showing the convex hull polygon
showing other points as “hallow circle”
2. Output Example

3. Using Pslib
You should use “Pslib” for making your postscript output.
Download the Pslib from the course homepage and read the manual.
4. cPoints class
Your main class should be implemented with “cPoints” class.
The class has point data and various functions
member variables (example)
m_nPoints: # of points
m_Data: point coordinates array
m_Stack: used for “Graham’s convex-hull algorithm”
…
member functions
m_ComputeBoundingBox: finding (min_x, min_y), and (max_x, max_y)
m_ComputeConvexHull: convex hull computation function
m_DrawPS: postscript output function
…
5. Implementation Condition
1) Stack Implementation
* You should follow the exact sequence of the class derivation in the class
* Object -> Container -> Stack -> StackAs…
2) Point Data Implementation
* You should use the “Array<t>” class (see Note 3)
3) Using Visitor or Iterator
* Your program should include at least one part using “visitor” or “iterator” for any work.
Solution
1) Describe the usage of your program, if any special usages or options exist.
At the Console Mode, Use the following form.
C : \> clustering ps_filename size
To execute this program, we need one command and two additional parameters
① clustering : It is the command to execute this program.
② ps_filename : first parameter. It is the ps_filename(the ps file is a PostScript file) that has hundreds of 2D point coordinates. The PostScript file has .ps extension name.
③ size : It is the cluster’s maximum size. The maximum size means the distance between the centroid of cluster and object included in the cluster. If you the 10 as a size value, then this program generate the clusters smaller than 10 size.
Notice : The test.ps file have to be in the same folder that has a execute file.
2) What algorithm did you use for the clustering? (Write the file name and line number having the algorithm implementation, too). Briefly explain the algorithm (with pseudo code if possible).
2-1) K-Means Algorithm.
I used the K-Means Algorithm.
Following are some K-Means Algorithms Properties.
* There are always K clusters
* There is always at least one item in each cluster.
* The clusters are non-hierarchical and they do not overlap.
* Every member of a cluster is closer to its cluster than any other cluster because closeness does not always involve the center of clusters. And, The following is the K-Means Algorithm Process
* The dataset is partitioned into K clusters and the data points are randomly assigned to the clusters resulting in clusters that have roughly the same number of data points.
* For each data point:
- Calculate the distance from the data point to each cluster.
- If the data point is closest to its own cluster, leave it where it is. If the data point is not closest to its own cluster, move it into the closest cluster.
* Repeat the above step until a complete pass through all the data points results in no data point moving from one cluster to another. At this point the clusters are stable and the clustering process ends.
* The choice of initial partition can greatly affect the final clusters that result, in terms of inter –cluster and intracluster distances and cohesion.
2-2) Whole Process Steps in My Program
[1] The data is inputed from the data file.(Text file that has a number of coordinates point.)
[2] Apply the K-Means Algorithm using inputed dataset.
[3] First, the K value is 1. It means that there are just only 1 cluster.
[4] All the points are belong to the clusters randomly. First case, there are only 1 cluster, so all points are belong to one cluster. But K > 1 Case, All points are belong to the clusters randomly, and almost equally.

[2 –1. Two Cluster’s region]
[5] And Considering of the each cluster’s centroid coordinates, compute the point’s distance and revise the point’s cluster and cluster’s region, continuously. (To know the detail process, see the above K-Means Algorithm Process),
[6]. Where there is no moving point, repeat the above calculation
[7]. After the calculation, We can get the clusters that classify points by distance.

[2 –2. Two Cluster’s region after calculation]
The above picture is outline picture to show the divided points. The real region’s shape is more strange.
[8]. Now, We have the cluster’s sets. But to identify the each cluster, we have to draw the boundary line of clusters. (The Post Script Library supports only grayscale color, so we can’t identify the cluster using color.) So, I draw a boundary line of clusters.
[9] Output the Cluster’s boundary line, and All points.
2-3) The Drawing Cluster’s Boundary Algorithm
To see the divided clusters more clearly, I makes the Drawing cluster’s boundary algorithm.

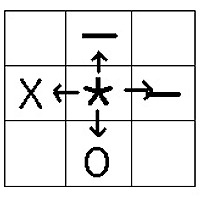
[2-3. Find the boundary point]
* First, Find the point that has a minimum Y position. See the picture. The blue point is the point that has a minimum Y position in this cluster. So we regard the blue point as base point. And calculate the angle that formed by the line that across the y-axis vertically and pass by the blue point, and the each point that is included same cluster. We have to fine the point that makes the smallest angle. The result, we can find the red point. Now, draw the line from the blue point to red point
* Second, After draw the first line, We regard the red point as a base point.

[2-3. Find the boundary point 2]
In this case, apply the same algorithm that I explained at first step. Then we can get the result such 2-3 Picture.
* Like this, after do all calculation, we can get the following picture. [The top and bottom line that are lined up each other is not drawn lines. Not important]

[2-3. Find the boundary point 3]
* And To draw the rest part, We can apply the same way, also. First, find the point that has maximum Y position. And apply the algorithm in reverse. In the result, we can get the result such a following picture. This picture shows the cluster surrounded by lines.

[2-3. Find the boundary point 3]
3) Attach the output image figures here (by screen capture). Present the exact cluster diameter for each problem.
3-1) Output Image1
The Input file : examples1.txt
The exact cluster diameter : 70

3-2) Output Image2
The Input file : examples1.txt
The exact cluster diameter : 50

3-3) Output Image3
The Input file : examples2.txt
The exact cluster diameter : 100

3-4) Output Image4
The Input file : examples3.txt
The exact cluster diameter : 80

3-5) Output Image5
The Input file : examples3.txt
The exact cluster diameter : 60

4) Details
4-1) Briefly explain about the member functions and variables of the classes you created (with file name and line number for the class interface).
There are two classes that I created in my program. These are CPoint class and GroupInfo Class.
CPoint class manages the points in the plane coordinates.
CGroupInfo class manages the cluster data.
4-1-1) CPoint Class
* Filename : CPoint.h, CPoint.cpp
|
* 4-1-1-1) Private Member Variables | ||
|
Variable Name |
Type |
Description |
|
m_x |
Float |
Save the x position |
|
m_y |
Float |
Save the y position |
|
m_group |
int |
Save the group number that the point is contained |
|
* 4-1-1-2) Public Member Functions | ||
|
Function(Parameters..) |
Return Type |
Description |
|
CPoint(float x, float y) |
None |
Overloaded Constructor |
|
GetGroupNumber() |
Int |
Return the group number that the point is contained. |
|
GetPositionX |
Float |
Return the X Position |
|
GetPositionY |
Float |
Return the Y Position |
|
SetGroupNumber(int group) |
Void |
Assign the group to the point. |
|
SetPosition(float x, float y) |
Void |
Set the X & Y Position |
|
SetPositionX(float x) |
Void |
Set the X Position |
|
SetPositionY(float y) |
Void |
Set the Y Position |
4-1-2) CGroupInfo Class
Filename : CGroupInfo.h, CGroupInfo.cpp
|
* 4-1-2-1) Private Member Variables | ||
|
Variable Name |
Type |
Description |
|
m_centroidX |
Float |
Save the centroid x position of the cluster |
|
m_centroidY |
Float |
Save the centroid y position of the cluster |
|
m_totalX |
Float |
Save Sum of X length of points included in the cluster |
|
m_totalY |
Float |
Save Sum of Y length of points included in the cluster |
|
m_pointCount |
Int |
Save the point count that included in the cluster |
|
* 4-1-2-2) Public Member Functions | ||
|
Function(Parameters..) |
Return Type |
Description |
|
CGroupInfo(CPoint centroid, CPoint total, int pointCount) |
None |
Overloaded Constructor |
|
SetCentroidX(float x) |
Void |
Set the centroid X position of the cluster |
|
SetCentroidY(float y) |
Void |
Set the centroid Y position of the cluster |
|
SetTotalX(float totalX); |
Void |
Set the sum of X length of points |
|
SetTotalY(float totalY); |
Void |
Set the sum of Y length of points |
|
ComputeTheCentroid() |
CPoint |
Compute the centroid position using totalX, totalY and m_pointCount |
|
GetCentroidX() |
Float |
Get the centroid X position of the cluster |
|
GetCentroidX() |
Float |
Get the centroid Y position of the cluster |
|
GetTotalX() |
Float |
Get the sum of X length of points |
|
GetTotalX() |
Float |
Get the sum of Y length of points |
4-2) Briefly explain about the overloaded operators (with file name and line number for the class interface).
I made overloaded operators for CPoint class. There are 4 overloaded operators in the Point Class.
- Filename -
* Point.h – Declaration file
* Point.cpp – Implementation file
1) inline CPoint operator+ (CPoint)
* Function : Add two points coordinates and assign the result to CPoint instance that call the operator.. The + operator calculate between X coordinates, and Y coordinates, independently.
* Return Value Type : CPoint
* Line number -
- Declaration : 21 (Point.h)
- Implementation : 66 (Point.cpp)
2) inline CPoint operator- (CPoint);
* Function : Subtract CPoint parameter coordinates from CPoint operator coordinates. The rest is similar to operator +
* Return Value Type : CPoint
* Line number -
- Declaration : 22 (Point.h)
- Implementation : 74 (Point.cpp)
3) inline CPoint operator= (CPoint);
* Function : Assign the CPoint parameter’s coordinates variables.
* Return Value Type : CPoint
* Line number -
- Declaration : 22 (Point.h)
- Implementation : 57 (point.cpp)
4) inline bool operator== (CPoint);
* Function : Check two CPoint coordinates variables. If two CPoint variables are same each other, return true, else return false.
* Return Value Type : boolean
* Line number -
- Declaration : 22 (Point.h)
- Implementation : 82 (Point.h)
5) Conclusion: What are the most difficult problems in the implementation? Did you think about any extension of the method or better algorithm for the problem?
① Most Difficult Problem
The Most difficult thing is to draw the each cluster’s boundary line.
For drawing a boundary, I have to find the outer points in each cluster. Among lots of points, Finding outer points is so difficult.
To find the outer points, I use the angular calculation.
And I think there are some error in my program. So, when we want to find the clusters that have small diameter, so much time is needed.
② Extension of the Method
The method that I used is the Non-hierarchical method. (K-means, EM-algorithm)
There are another method about the clustering. It is a Hierarchical Clustering.
There is such a following method in the hierarchical clustering.
- Single Link : Similarity of two most similar members
* Feature : Relative efficient, Long straggly clusters, Loosely bound cluster
- Complete Link : Similarity of two least similar members
* Feature : Tightly bound cluster
- Group-Average : Average similarity between members
* Feature : Intermediate between single and complete
and so on..
* The following process is used in hierarchical clustering.
① Determine all inter-object dissimilarities

② Form cluster from two closest objects or clusters
③ Redefine dissimilarities between new cluster and other objects
④ Return to Step2 until all object are in the one cluster
* Calculate Inter-object dissimilarity -> For each object Find the closest object -> Form cluster and Recalculate dissimilarity -> Repeat (Go to Second Step)
* Advantages of using K-Means Algorithm (Compare with Hierarchical Clustering)
- With a large number of variables, K-Means may be computationally faster than hierarchical clustering, only K is small.
- K-Means may produce tighter clusters than hierarchical clustering, especially of the clusters are globular.
* Disadvantages of using K-Means Algorithm (Compare with Hierarchical Clustering)
- Difficulty in comparing quality of the clusters produced.
- Fixed number of clusters can make it difficult to predict what K should be.
- Does not work well with non-globular clusters.
- Different initial partitions can result in different final clusters. It is helpful to rerun the program using the same as well as different K values, to compare the results achieved.
6) Reference Data
- K-Means Clustering (Brian T. Luke)
- K-Means Clustering Algorithm
- K-Means Clustering Overview
- A Tutorial on Clustering Algorithms
- K-means and Hierarchical Clustering
 Clustering.zip
References
1) K-means and Hierarchical Clustering
 kmeans09.pdf
2) Clustering - KAIST CS LAB
 Clustering[1].ppt
3) Pslib Manual
4) POSTSCRIPT Language Tutorial and Cookbook
'개발&컴퓨터 > 알고리즘' 카테고리의 다른 글
| [알고리즘문제] 문자열 정렬하기 (0) | 2016.05.17 |
|---|---|
| Search in Artificial Intelligence (기초) (0) | 2016.02.29 |
| Cellular Automata 를 이용한 Forest Fire Modeling 구현 (2) (0) | 2015.09.12 |
| Cellular Automata 를 이용한 Forest Fire Modeling (1) (0) | 2015.09.07 |
| [알고리즘문제] 컨테이너 포장 (0) | 2015.08.12 |